")
Air Sciences Inc.
Background
Air Sciences Inc. is an environmental consulting firm that has served clients for over 40 years. Their projects span a range of air quality services, with projects in permitting and compliance (especially in the mining industry), support for dust mitigation projects, and community monitoring. The team installs and operates a range of EPA-approved instruments that monitor meteorological parameters and measure criteria pollutants. Some of these include monitoring for ozone, NO2, PM10, PM2.5, and other pollutants.
Replacing labor-intensive in-situ monitoring for a client
Dr Katie Kolesar, Senior Air Quality Scientist at Air Sciences Inc. and her team recently launched a public dashboard with eagle.io that saves a long-time client hours of manual labour each week.
Before the dashboard, the client had the labour-intensive challenge of maintaining evaporation pans as a means to monitor the water balance of process ponds and tailing impoundments. The client’s operators would have to physically maintain the pans and review data. These pans are prone to inaccurate measures of evaporation as local wildlife drink the water collected in the pans. The collected water can also freeze during winters making it impossible to measure.
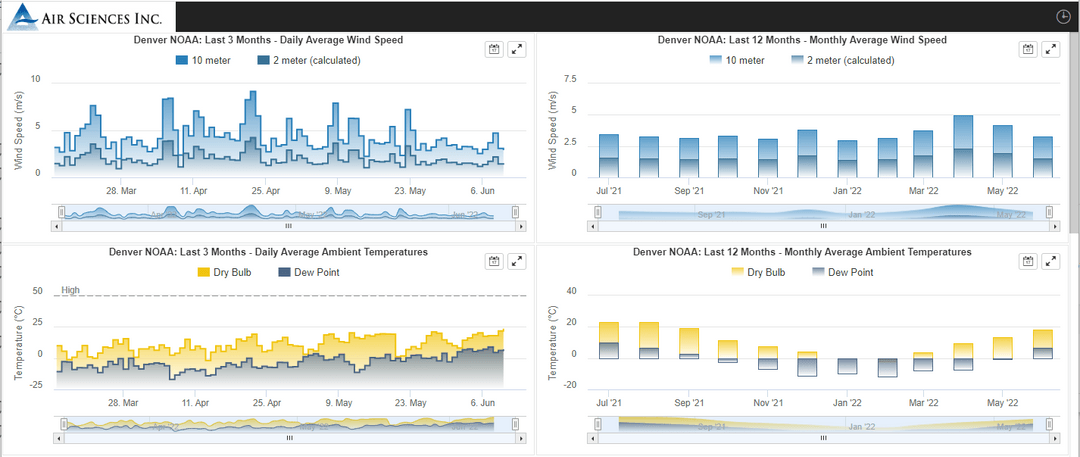
With eagle.io, Katie and the Air Science Inc. team developed a user-friendly dashboard that calculates theoretical total evaporation using publicly available NOAA meteorological data.
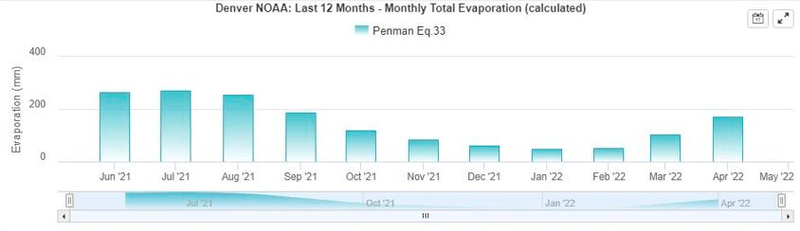
“We use calculations to present evaporation rates to clients on a historical basis by using the precipitation and then the theoretical evaporation rate to create a water balance. One of our long-time clients loves the feature and uses it all the time.”
This solution means their client can quickly check this dashboard as part of the active management of their water and tailings pond management. It has removed the need and cost of labour-intensive evaporation pan maintenance and the issues of wildlife interference and freezing temperatures.
The Challenges: working around an older system before eagle.io
- Air Science Inc. previously had an outdated system that required expensive updates and substantial ongoing maintenance
- Team members had to wait on a programmer to make changes or add new stations
The team had multiple projects that required ongoing monitoring and needed new tools and modern capabilities. The old system wasn’t user-friendly and required a programmer to make changes and updates to station configuration, and reports. In addition, there was no visual interface for clients to interact with data. This meant scientists had to wait on a programmer for basic tasks and clients had to wait on scientists to download and visualise their data.
“We had an outdated data validation system and it was going to need a lot of work to make a new version. So we were looking for something reliable that we wouldn’t have to maintain.” Katie, Senior Air Quality Scientist at Air Sciences told us.
The Solution: switching to a user-friendly environmental intelligence platform
- The whole team can now quickly configure and update user-friendly dashboards
- Their scientists can create unique dashboards and alerts for specific users
With eagle.io, Air Sciences Inc was able to save hours of time and frustration for their team by removing the programming bottleneck of setting up graphs and displays. Katie told us;
“One thing that eagle.io has that our old platform didn’t have is the user-friendly interface through which we can create graphs and ways to display the data. With other systems, there was a constant lag for updates as we waited on the programming staff. With eagle.io anyone can do it.”
Now the entire Air Sciences team (even those who can’t program) can quickly build and update dashboards, even configuring dashboards for specific users.
“It’s nice to be able to configure the dashboards and charts. I’ve configured dashboards that are specific for specific users and people who are interested in different aspects of the data.”
Using eagle.io Air Sciences Inc. can easily satisfy each client’s different needs.
“We now use the software for all of our monitoring needs. This includes the QA/QC of data that is then used for quarterly reports delivered to state regulatory agencies for review and approval. For some clients who need to be alerted if any pollutant concentrations are high, we have set up alerts.”
The Results: what Air Sciences Inc. achieved
- Built custom functions for clients – the platform’s flexibility allows their team to develop fit-for-purpose tools (such as the Evaporation calculation dashboards)
- Removed programmer bottlenecks – their whole team can use eagle.io, freeing up staff to make changes and better serve clients without needing IT
- Added value to clients through alerts – they can provide ongoing value to clients with real-time alerts for pollutant concentrations and precipitation levels
By adopting eagle.io, Air Sciences no longer requires personnel on staff to maintain and update their old data systems, saving expensive programmer wages. Katie and the Air Sciences team have also been able to set up client alerts in eagle.io that continually add value to their clients.
“Being able to do the alerts is great. We have some folks that we have alerts set up for precipitation. They need to pay close attention to their water balance to ensure their ponds do not overflow. We have an alert set for 0.1 inches per day, 0.2 inches per day, 0.3 etc. We have other clients who have concentration-based alerts for other parameters. That’s been one of the most useful ongoing things for clients.”
Air Sciences found that using eagle.io removed an IT bottleneck and empowered their scientists and technicians to access and use data.
“It’s user-friendly, so some of our team who do not have programming knowledge are able to get the information that they need. They have been able to step in, look at and use the data.”