The University of Queensland – Robotics IoT water monitoring
See how UQ engineered a water monitoring system using a drone, a Libelium Waspmote, Xylem
sensors and a Surfbee surface vessel. Robotics enabled, IoT water monitoring, with auto-updating
and filtering of GIS data.
“The big benefit is it takes away all the sifting and cleaning of the data. It has streamlined
our ability to go from a handful of sites, to hundreds.”
Background
focuses not only in classic structural engineering. Increasingly, it has been integrating holistic aspects such as community and social responsibility, as well as environmental research. Their motto is: “Re-engineering civil and environmental research to make communities work better.”
Part of their research focuses on water monitoring and environmental management. The UQ. School of Civil Engineering is involved in monitoring water quality across a range of projects and environments from lakes, rivers, coasts and offshore. Historically they have used traditional approaches: A technician would either visit several sites for on-off spot sampling or deploy an instrument for collection and manual downloads after several weeks.
Some of these monitoring projects sought to characterise spatial variability in a water body over time. This could only be achieved by deployment of a network of permanent sensors over a water body (generally at a less than ideal density) or manual in-situ sampling across the water body by a boat.
“It is always a trade-off between spatial and temporal resolution when we have limited human resources and equipment. These manual approaches typically do not capture the critical events that drive pollutant loading. The reality was that a lot of the time we were manually recording single data points. Or in some cases with sensors on autonomous platforms, we would be storing data on the sensor, downloading it the next day in the lab, and then go about post-processing time stamps with GPS data,” said Simon Albert, Senior Research Fellow.
The Problem
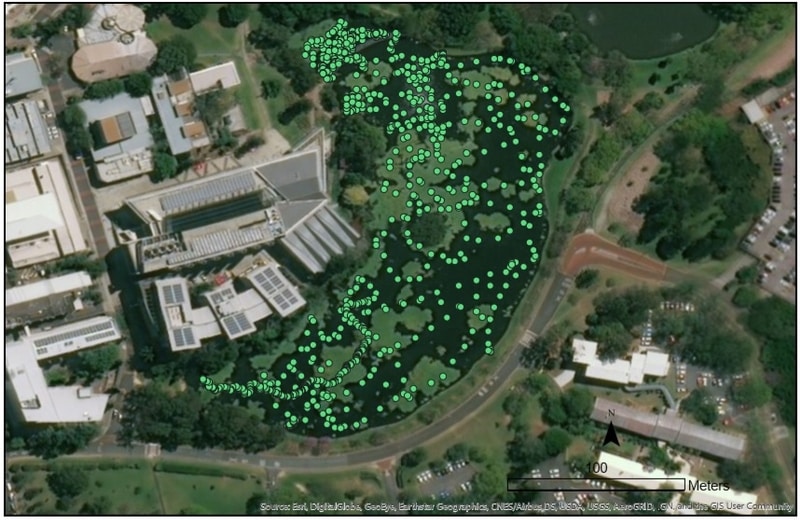
Figure 1. Lake water chlorophyll monitoring – Acquisition setup modelling (200 data points)
As the UQ team started using autonomous systems with increasing spatial and temporal data gathering capacity, this manual/in-situ approach proved inadequate in terms of data acquisition coverage.
Key limitations identified were a) insufficient amount of data sources that could be set up, b) excessive time taken to set up each data source, c) data cleaning, editing, visualisation and mining. For a lake water project for example, monitoring chlorophyll distribution, the UQ scientists determined that at least 200 data points over the lake was required, which was not feasible as a permanent monitoring network and was expected to take days of manual effort to collect manually.
UQ started monitoring more and more sites (100+) adding exponential pressure in terms of data acquisition efficiency requirements. This labour-intensive approach was becoming prohibitively expensive in time and resources. Cost, and time had to be saved and/or optimised, while raising the bar on monitoring deliverables.
Some of these sites were also proving dangerous to work on. Water monitoring in spillways, dams, contaminated waters, or peak flood currents can be highly dangerous. Their challenge was therefore twofold: Engineering a safer, more efficient data acquisition solution, and a more efficient data mining, cleaning and visualisation solution.
To automate the data collection and processing UQ implemented the following hardware
software solution:
– Integrating a Xylem Exo sonde onto an unmanned surface vessel (Surfbee.io) to allow one sensor to automatically capture gridded data over a lake.
– Integrating a customised Xylem Exo sonde onto an autonomous aerial vehicle or drone to sample from inaccessible waterbodies.
– Using Libelium WaspMote to stream water quality data together with GPS location to Eagle.io for data mining, and visualisation.
This solution addressed two distinct issues:
Better performance for the base acquisition of water data, through unmanned vessels and drones.
Better visualisation, mining, cleaning of the data and related alerts via eagle.io
1- Base data acquisition – data sources coverage:
This first component of the data collection solution was to automate the sample collection process UQ started investigating unmanned systems, surface vessels and drones, connecting sensors to those autonomous vehicles to automate sample collection.
After research and procurement UQ finalised this end of the system engineering. They relied on a Libelium Waspmote, attached to a drone collecting and transmitting data acquired by a “Surfbee” unmanned surface vessel for water quality data acquisition which could not be done by drone.
2- Data cleaning, filtering, updating, mining, and visualisation:
The second step was in simple terms, dealing best with large amounts of files and data collected, to generate the best, most relevant insights at the least expense of time.
Automating the association with quality data gathered from the sensors with GPS data coming from a second system and quality coding and editing data (e.g. removal of sensor readings when a drone was travelling between sample points and sensor was suspended in the air)
Says Simon Albert: “(Eagle.io lead developer) Ridwaan Amod configured our system so we could capture and filter the data as it was coming in, and instantly we got a high spatial density of data. Immediately it could be stored on your platform so we could then export it seamlessly to GIS software for further analysis. The R&D investment in integrating robotic systems with IoT communication platforms and Eagle.io is now starting to pay off in terms of the efficiency gains in sampling.”
The Outcome
One of the key outcomes achieved through the implementation of eagle.io was increased
responsiveness and ease of use:“So in a matter of about an hour we can now survey an urban lake in a safe/efficient manner, garnering hundreds of data points, instead of only a few previously. So we definitely have better insights, but also better efficiency and safety in places were boat access is not possible.”
Safer HSE / Enhanced capability:
“We can now access any site at any time much more easily. The remote monitoring system we’ve engineered enables staff to safely collect data from places with strong currents, contaminated waters or physical barriers for boat access.”
Versatility and System setup:
“The rapid support at Eagle.io was an important factor that contributed to the success of this project. Questions we had were answered in minutes, and the one-on-one support was great.
Automation, Time & Cost savings:
“The big benefit is it takes away all the sifting and cleaning of the data. It has streamlined our ability to go from a handful of sites, to hundreds.”
What UQ has to say
Simon Robert, Senior Research Fellow said,
“Our favourite feature is the fact that the map can be dynamically updated. Our latitude and longitude streams are fed straight into your map interface. And it all updates dynamically in real-time.”
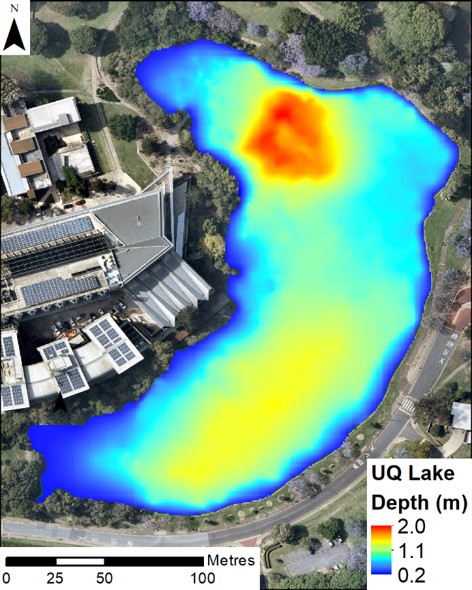
Figure 2.Lake depth visualisation based on 200 data points acquisition
")