Make working with ever-changing environments
second nature.
eagle.io is an environmental data management platform built for consultants and scientists. Our cloud platform makes it simple for our customers to provide powerful real-time environmental monitoring and analytics to clients.
What We Monitor

Hydrometrics
Quality, Flow, Levels, Storm, Ground, pH, Pressure, Turbidity, Particulates, Sediment & more

Meteorology
Wind, Rainfall, Temperature, Precipitation, Conductivity & more

Air and Noise
Particulate Matter (PM10, PM2.5), Gas, Dust, Decibels (dBA), Vibration, Pressure, LAeq & more

Metocean
Turbidity, Current, Wave, Tide, D.O., Depth, Salinity, Temperature & more
Environmental intelligence.
Built for scientists, engineers, and consultants.
Integrated with a network of sensors, our environmental intelligence cloud platform unlocks knowledge to help scientists, engineers, and consultants make the most of opportunities and protect what matters.


Hit the Ground Running

Unlock Opportunity

Protect What Matters
An intuitive platform that scales with you, without the need for a developer.
Connect
Easily Connect Sensors
With no license keys to manage, and available on any device, our cloud-based platform makes it easy to manage a portfolio of clients, projects and time-series data assets from one intuitive interface.

Understand
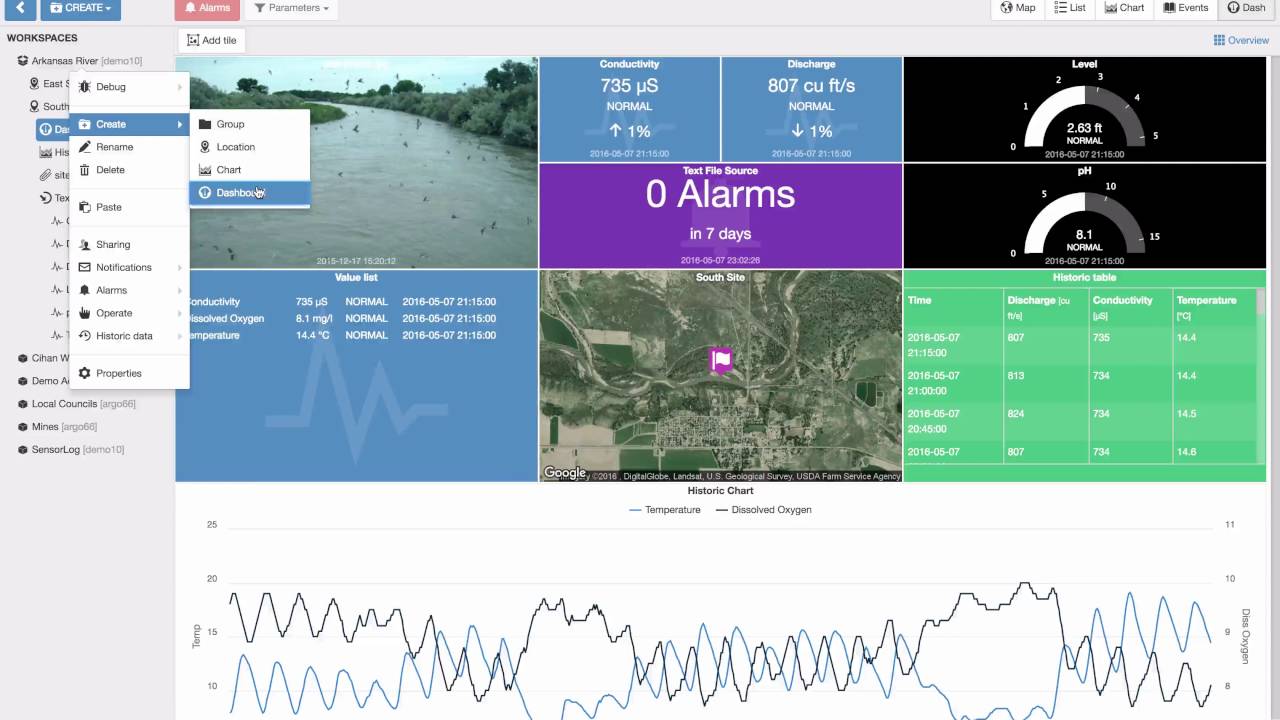
Transform Data Into Visual Insights
Transform raw data into valuable insights. Our streaming analytics and real-time charting module make it easy to get a clear picture at a glance.

Be ready
Know What’s Happening in Real-Time
Know what’s happening in real-time, and be alerted to events as they unfold – helping you take timely action.

curate
Share Insights Directly With Your Clients
Make it your own. Create custom dashboards and white-label the platform with your own branding to position yourself as the expert to clients.

Underpinned By Our Powerful API
Our flexible API enables you to integrate publicly available data sources from governments and organizations to enrich your monitoring programs, enhance your insights, and share data with your systems, databases, and teams.

2023 Insights into Environmental Monitoring
Identify opportunities to automate and digitize your environmental monitoring based on global research into current and future practices.

Case Study –
Specto Technology
Greater awareness creates opportunities to drive efficiencies and build value for Specto Technology.
eagle.io is trusted by the world’s best environmental scientists, engineers, and consultants.


eagle.io at a glance
Parameters
Environments
Users
Sources

Latest resources
 Environmental Technician
22nd October 2024 | Environmental Manager/Owner
Create a Dashboard
Environmental TechnicianEnvironmental Manager/OwnerAsset OwnerAllTutorialsProduct DemoVideo Meteorology
22nd October 2024 | Environmental Internet of Things
Adapt or die - Adoption of Environmental IoT by environmental consultancies
MeteorologyEnvironmental Internet of ThingsFeaturedHydrometryEnvironmental Manager/OwnerBlogAllMetoceanAir & Noise Featured