Port of Townsville
“We can now get environmental information out there in real-time to our stakeholders and operators who rely on it.”
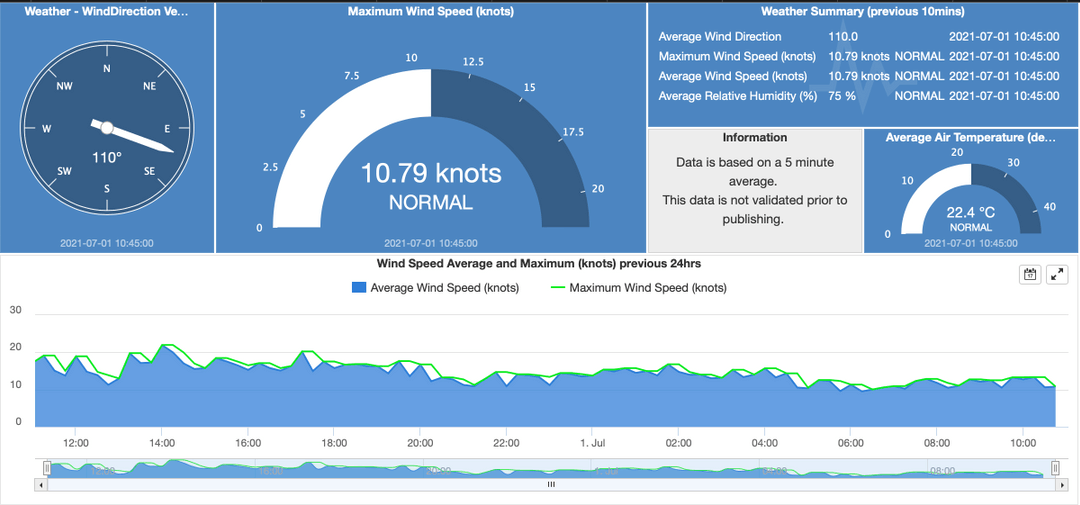 Image 1. Screenshot of POT Public Dashboard through Eagle.io
Background
Port of Townsville (Port) manages the largest multi-purpose cargo port in Australia. Each year, around 8 million tons of cargo travel through the port.
Monitoring programs: their Environment and Planning team monitor and communicate conditions in Cleveland bay (wind speed, wind direction, currents, tides & more) to their marine pilots so they can safely dock ships in the port. They also monitor water quality compliance (EC, turbidity & more) for government regulators and weather conditions (wind, temp, etc.) for local community stakeholders.
Sensitive environmental location: the Port is located within the Great Barrier Reef World Heritage area, and as part of their environmental stewardship POTL has undertaken extensive environmental monitoring for over 20 years. Through regular community engagement activities, they found that environmental protection is the number one interest among community members and stakeholder groups.
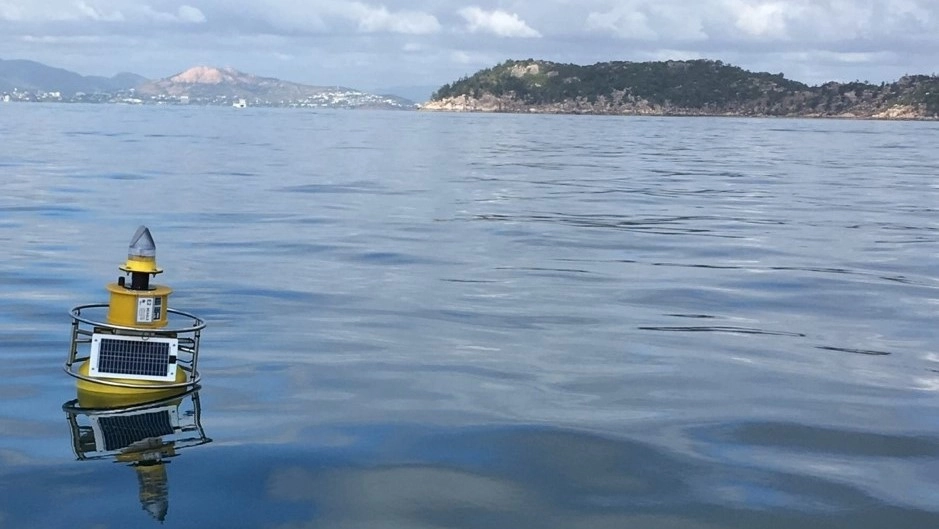
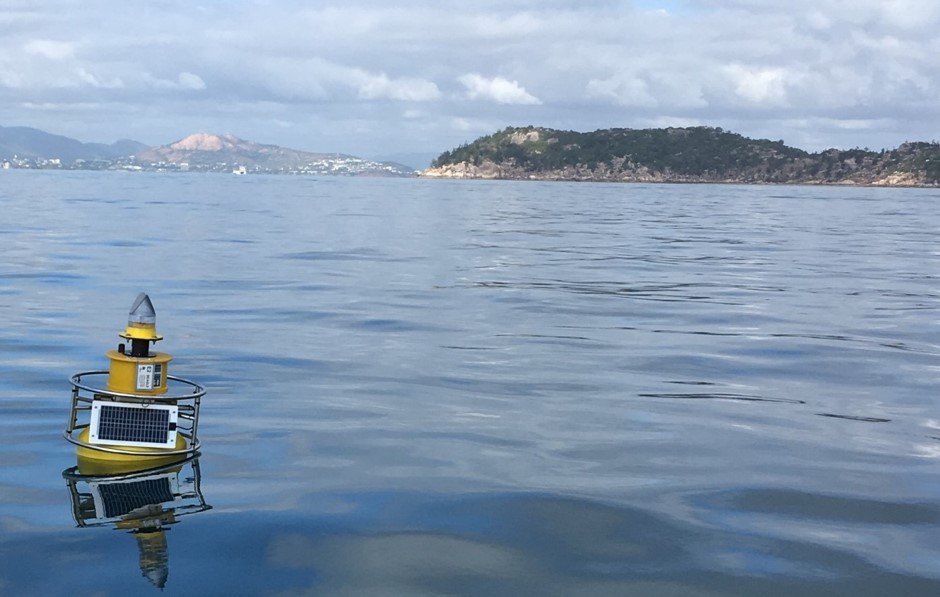 Image 2. POTL Marine buoy with Xylem EXO & Gill Water Quality Sensors
The Challenge
Since 2017 POTL has been implementing real-time monitoring technology in several environmental monitoring programs, including weather and water quality. The challenge was finding a way to best communicate real-time data to key stakeholders.
Managing different stakeholder interests: “The Environment & Planning team at the Port were challenged with communicating real-time environmental data to the community and internal operators in the port,” Ms Glen said.
Manual data collating/sharing: “Previously the team spent hours manually collating data into spreadsheets then uploading graphs into dashboards via the Port’s website, often requiring the involvement of internal departments.”
Difficulty sharing real-time data: “We needed to be able to manage the monitoring programs from the setup of the equipment to maintenance and calibration as well as the communication of a tremendous amount of real-time data in an easy-to-understand real-time dashboard.” Ms Glen said.
Solving This Challenge
Real-time dashboards through an easy-to-use environmental sensor platform
The Environment & Planning team at Townsville Port were looking for a platform that could help them monitor and communicate real time environmental data to their community and stakeholders. They needed an easy-to-use solution that enabled the team to manage environmental sensor data entirely in-house, without the involvement of other internal IT departments, or external consultants.
One platform: “We just needed one platform where all our real-time data could go that would give us the ability to do data validation, as well as complex calculations and be able to make it publicly available on a dashboard. Eagle-io fit the bill,” Ms Glen said.
“The team looked at other platforms but none met their requirement of user experience and simplicity which would give the Environment & Planning team complete management of monitoring programs from the sensors in the field to the real-time dashboards.
Software they could manage without IT: “It’s just so easy to use. It’s all web-based. It’s really intuitive and we can do in-house quality checks and data validation. I’ll go into the software, have a look at the data and validate within the system on that day.” Ms Smith said.
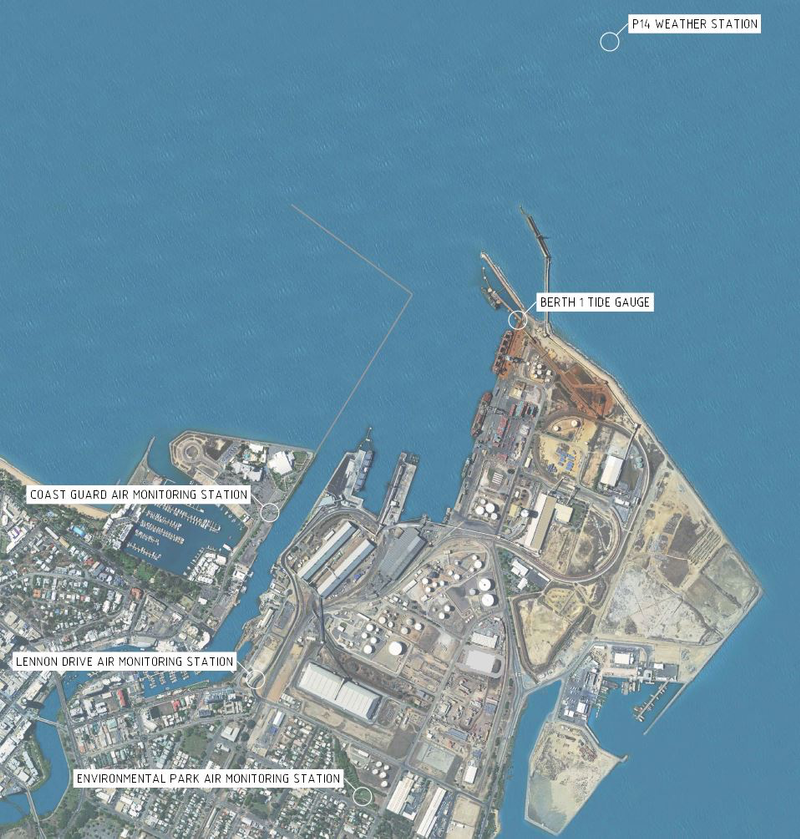 Image 3. POTL Monitoring Stations
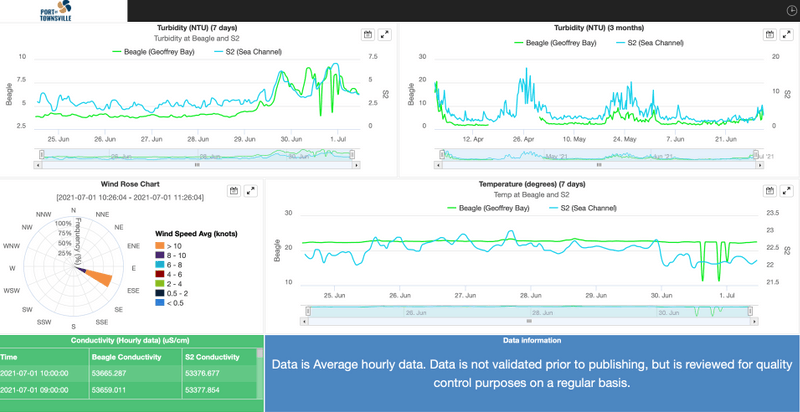 Image 4. Screenshot of POTL’s Water Quality public dashboard (https://public.eagle.io/public/dash/gi7cxkl9yo9atkv)
Impact with eagle.io
Now the Port can serve thousands of customers (internal & external) real-time dashboards with weather and water quality conditions critical to operations.
Communicate monitoring in real-time: “We could have gone with just an off-the-shelf database and plugged all the data in there and sorted it manually to do graphs and put that online. That’s still a way to present it with the community but what is nice about Eagle.io is that it all happens in real-time with not a lot of manual handling from our side,” Ms. Glen said.
Serve different stakeholders operation-critical data: “The marine pilots hop on the ships at the end of the Port’s channel and bring the vessel safely into Harbour. For them it’s really critical to know current wind speed and wind direction so that they can take it into consideration to bring large ships into the Port safely. They get access to all this in real-time with an internal eagle.io dashboard.” – Elaine, Acting Manager Environment and Planning
Local water enthusiasts, including kite surfers, have also found the data useful, logging thousands of hits to the public weather dashboard. As the weather sensor is located on the water and is updated every 15 minutes, it is also meeting a need in the community for this data.
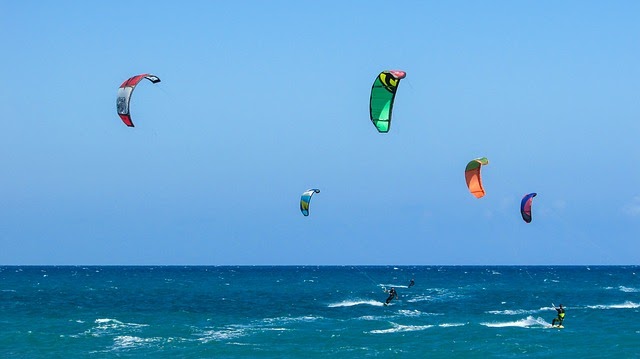 Image 5. Kite surfers
Recently POTL received a highly-commended DCN award: “We recently received a highly commended Environment award from the Daily Cargo News. Our application had multiple elements and featured our monitoring programs and the dashboards that we’ve been able to create and put out there.”
“Every step of the way – we have ownership of our environmental monitoring programs, from the sensors we put in the field, to the data from these sensors to the real-time dashboards that we create with Eagle-io that we share.” – Elaine, Acting Manager Environment and Planning
- 700,000 community stakeholders in North Queensland
- 600 vessels/year relying on the data
- 15 data sources
- 3 public-facing eagle.io dashboards
- 19 unique parameters monitored
